Texas
Texas Drought Monitor by County
New Drought Monitor maps come out on Thursdays. Use the county list below to see what part of your Texas county is abnormally dry or in drought, and whether that share grew or shrank over the past four weeks.
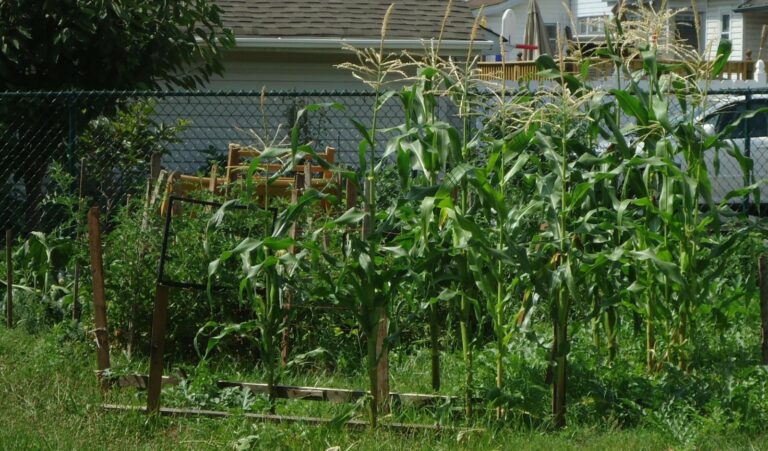
Photo: Tall corn and other vegetables growing in a fenced backyard garden. Tomwsulcer, CC0, via Wikimedia Commons
Check your Texas county on the Drought Monitor
Numbers load from the weekly U.S. Drought Monitor county statistics.

Drought Monitor categories explained
| Category | Name | Possible impacts, as the Drought Monitor describes them |
|---|---|---|
| D0 | Abnormally Dry | Going into drought: short-term dryness slowing planting and growth of crops or pastures. Coming out of drought: some lingering water deficits. |
| D1 | Moderate Drought | Some damage to crops and pastures; streams, reservoirs or wells low; some water shortages developing. |
| D2 | Severe Drought | Crop or pasture losses likely; water shortages common; water restrictions may be imposed. |
| D3 | Extreme Drought | Major crop and pasture losses; widespread water shortages or restrictions. |
| D4 | Exceptional Drought | Exceptional and widespread crop and pasture losses; shortages of water in reservoirs, streams and wells, creating water emergencies. |
Category names and descriptions follow the U.S. Drought Monitor drought classification. The map is made by authors who combine rainfall, soil, streamflow and local reports, and it is released every Thursday for conditions on the Tuesday before.
Texas water restrictions: what the state publishes
TCEQ list of public water systems limiting water use
The list covers public water systems that reported restrictions in place and have self-reported their water use restrictions since January 1, 2025. It is a list of individual water systems, not a statewide order.
Texas Commission on Environmental Quality. Report generated September 16, 2026 when read. Read November 14, 2026.
More for Texas: Texas on Drought.gov, lawn care calendar, what to plant now and Texas gardening.
Texas drought now: questions
How do I find drought conditions for my Texas county?
Open the county list at the top and select yours. You get the latest category shares for that county and how they differ from the maps one and four weeks earlier. For the whole Texas map, use the Drought Monitor site.
How current is the county drought data?
The map changes once a week, on Thursday, using data through Tuesday. Between releases the numbers on this page stay the same, so checking more than once a week will not show new figures.
How are the percentages calculated?
A percentage tells you how much of the county's area is at that category or higher, so the numbers get smaller from D0 to D4. Drought boundaries do not follow county lines, which is why one county can appear in several rows.
Do Texas lawns have watering limits now?
The list covers public water systems that reported restrictions in place and have self-reported their water use restrictions since January 1, 2025. It is a list of individual water systems, not a statewide order. Source: Texas Commission on Environmental Quality, Report generated September 16, 2026 when read.
What source does this drought page use?
The U.S. Drought Monitor is the source. It is a partnership of the National Drought Mitigation Center at the University of Nebraska-Lincoln, USDA and NOAA, and the county numbers are taken directly from its data service.
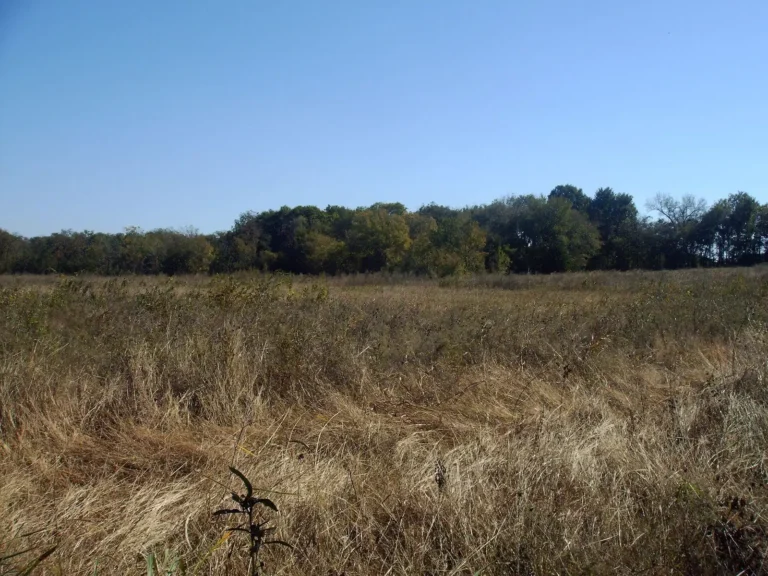
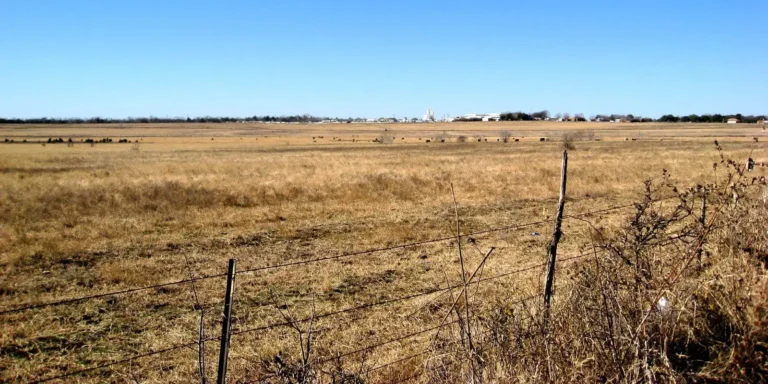
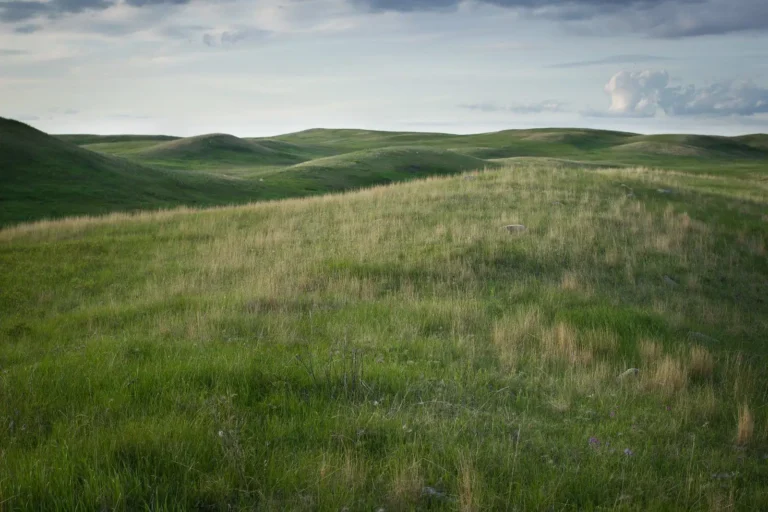
Photos: Tall corn and other vegetables growing in a fenced backyard garden: Tomwsulcer, CC0, via Wikimedia Commons; Tall native grass meadow in North Texas: gurdonark, CC BY 2.0, via Flickr; Dry Central Texas grassland behind a barbed-wire fence: Staeiou, CC BY-SA 2.0, via Flickr; Rolling shortgrass prairie under a cloudy sky: jmeissen, CC BY-SA 2.0, via Flickr; Prescribed fire on shortgrass prairie: GoodFirePhotos, Public domain, via Flickr.